Install and use Runsnake
It is a good idea to profile code to speed up runtime.
Install and set up RunSnakeRun
First, we create a separate conda environment for runsnake. We need to use Intel architecture since wxpython 4.0.7 is not available for arm, and runsnake does not work with newer wxpython (https://github.com/mcfletch/runsnakerun/issues/3), Py3.8 version is required for older wxpython.
1. Make sure you have conda installed
Install conda if necessary. For Apple Silicon, you need native conda, which you can get here: https://github.com/conda-forge/miniforge/releases
You can check if you have conda installed by simply typing conda in the terminal.
You can get the location of the base_environment for conda (not to be confused with the conda_base directory of your phenix installation!) with this command:
conda info | grep base
The output is something like this:
base environment : /Users/dcliebschner/Software/miniforge3 (writable)
So the base_environment diretory is /Users/dcliebschner/Software/miniforge3 .
2. Install Runsnake
Execute these commands to install runsnake. You can do it anywhere.snake_x86 is the name of the environment, so you can choose another name if you prefer.
CONDA_SUBDIR=osx-64 conda create -n snake_x86 python=3.8
conda activate snake_x86
CONDA_SUBDIR=osx-64 conda install wxpython=4.0.7
pip install runsnakerun
Note: For x86_64 conda architecture one should be able to omit CONDA_SUBDIR=osx-64 part of the commands and get the same result.
3. Set up an alias
It is a good idea to use an alias. your_base_environment_here is the location of the base_environment for conda (see step 1 above).
alias runsnake='your_base_environment_here/envs/snake_x86/bin/pythonw your_base_environment_here/envs/snake_x86/lib/python3.8/site-packages/runsnakerun/runsnake.py'
Profiling a script
libtbx.python -m cProfile -o prof.out myscript.py my_model.pdb
myscript.py is the code that is being profiled. This script may or may not have inputs. In this example the script has the input my_model.pdb.
The alias runs the runsnake.py script that is installed in phenix/base.
Profiling with the ProgramTemplate
Use the --profile command line flag. If the ProgramTemplate is called by the "run_program" function in iotbx/cli_parser.py (i.e. you have the basic boilerplate code in your file in the command_line directory), you will get a profile.out file.
mmtbx.hydrogenate 1kyc.pdb --profile
The file is hardcoded to "profile.out" so that the parser does not get confused (e.g. there is a default filename when no argument is provided, but "--profile model.pdb" should not dump the stats into model.pdb).
Note that if you customize how you run your program, then you would need to handle the profiling manually.
Looking at the profiling output
After profiling you can view the file with (if you set up an alias, see above):
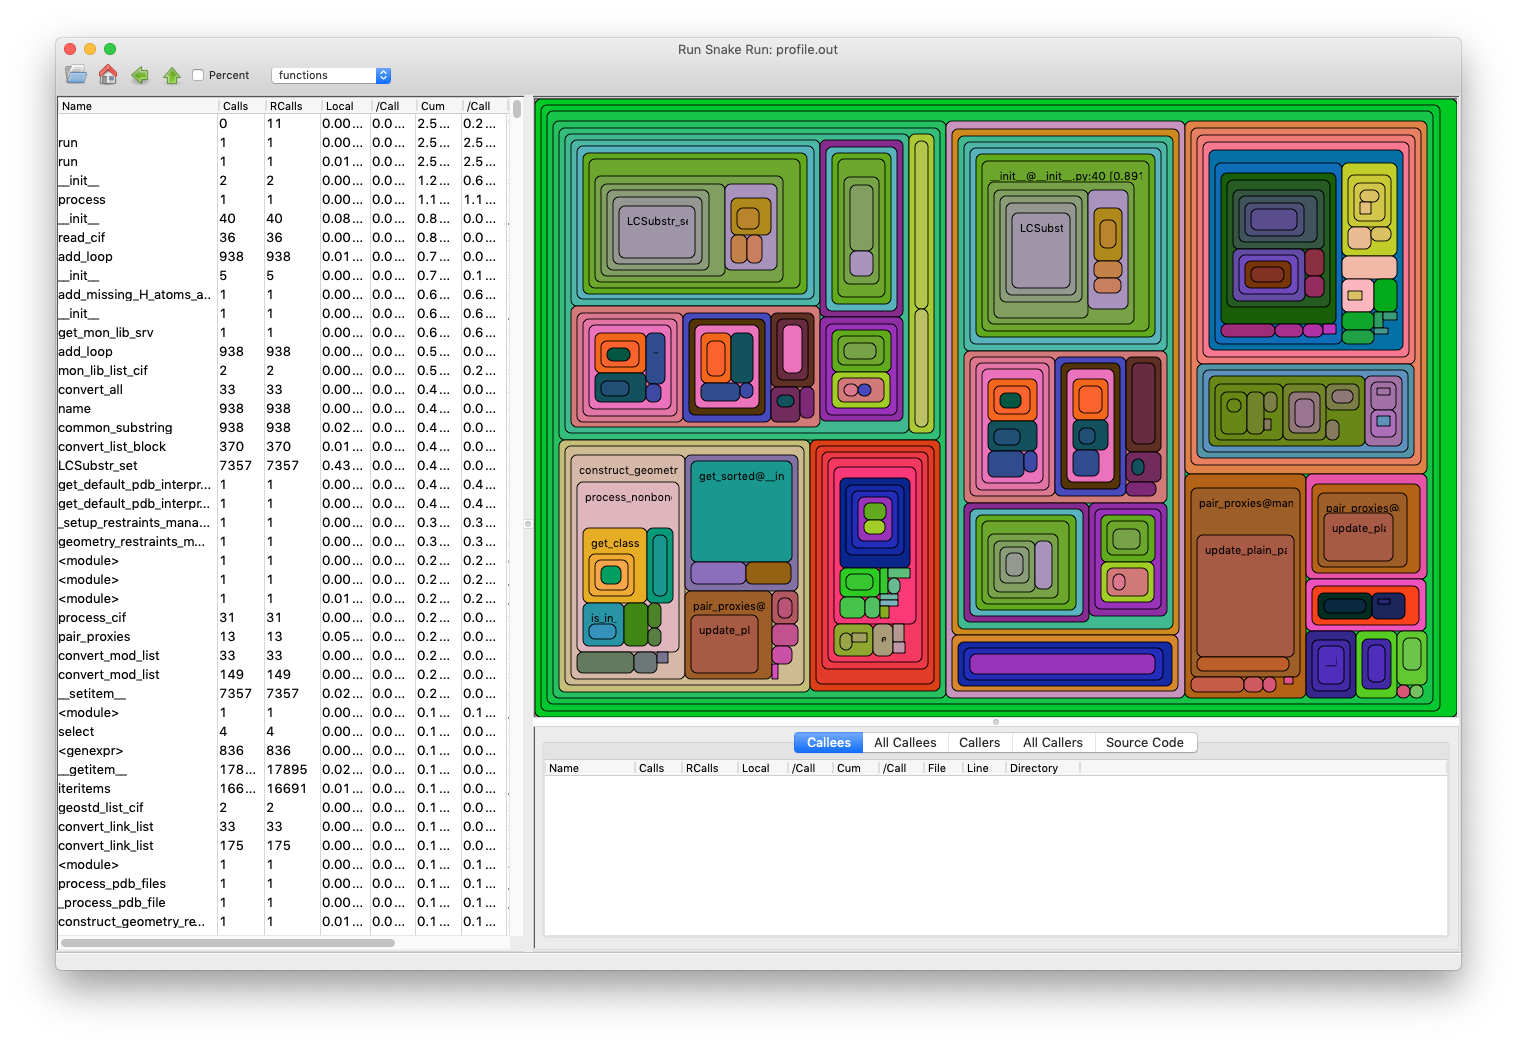
runsnake prof.out
In the output of the above command, you will see many squares of different size. The size is proportional to runtime. In the square you can find what it is exactly (function name). When you hover with mouse over a square, the same functions are highlighted as well, so it is easy to see if something is run from different places.
You can also use a flag, so every command outputs a runsnake profile:
setenv LIBTBX__CPROFILE_FLAG__ 1